Descending Triangle Pattern

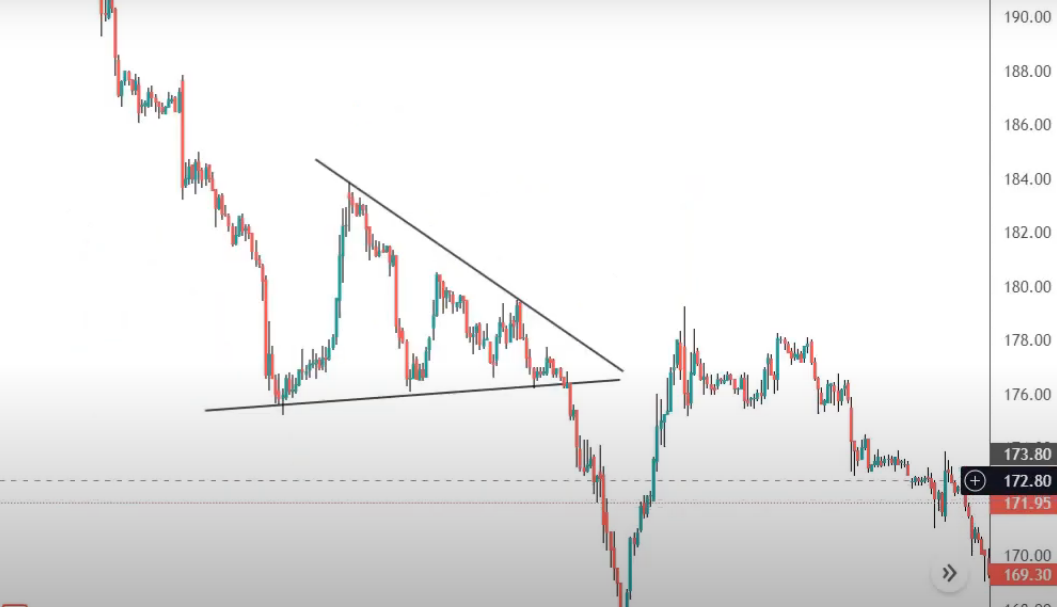
Represents stock consolidation, prior downtread before triangle formation.
Result : either be berish or bullish, but mostly berish.
Entry : breakout with maximum volume trying to break triangle pattern.
Target : maximum width of triangle price range.
No comments:
Post a Comment
Your feedback may help others !!!